How to Fix Marketing Agency Reporting Bottlenecks
Learn how to fix marketing agency reporting bottlenecks with cleaner data, faster QA, stronger client narratives, and less margin leakage.
Reporting bottlenecks feel like a normal part of agency life until they start quietly eating delivery margin.
A strategist waits on a media buyer. The media buyer waits on CRM exports. The account manager rewrites the narrative at 9 p.m. A senior leader jumps in for QA because no one trusts the numbers. The client receives the report late, skims it, asks the same questions again, and the cycle repeats next month.
For many B2B agencies, the problem is not that the team is lazy or that the reporting tool is wrong. The real issue is that marketing agency reporting is treated as a monthly deliverable instead of an operating system. If the workflow depends on heroic manual effort, undocumented judgment, and last-minute interpretation, it will always bottleneck as the agency grows.
The fix is not simply “automate reporting.” Automation helps only after the agency has clarified what should happen, who owns each step, which definitions matter, and where quality control belongs. Otherwise, you just accelerate confusion.
What a reporting bottleneck really looks like
A reporting bottleneck is any recurring delay, rework, or dependency that prevents the agency from turning performance data into client-ready decisions on time.
That distinction matters. Reports are not valuable because they contain charts. Reports are valuable because they help clients decide what to keep doing, what to stop, what to fund, and what to investigate next.
Common bottlenecks include:
- Data is scattered across ad platforms, CRM, analytics, spreadsheets, and client-owned systems.
- Metric definitions change by client, team member, or reporting cycle.
- Campaign naming is inconsistent, which makes filtering and grouping unreliable.
- QA depends on one senior person who is already overloaded.
- Account managers rewrite reports from scratch because the data does not explain the story.
- Reports are built for internal completeness instead of client decision-making.
- Clients ask follow-up questions that should have been answered in the first version.
If any of those sound familiar, the bottleneck is not a single broken step. It is a workflow design problem.
Diagnose the bottleneck before changing tools
Many agencies jump straight to a new dashboard, BI connector, or AI reporting assistant. That can help, but only if you know where the reporting process is failing.
Start by mapping the reporting flow from raw data to client decision. Do not map the ideal version. Map what actually happens in a normal month.
| Bottleneck symptom | Likely root cause | Best first fix |
|---|---|---|
| Reports are always late | Too much manual collection and unclear ownership | Assign owners by stage and automate repeatable data pulls |
| Numbers change during review | No locked metric definitions or QA gate | Create a metric dictionary and validation checklist |
| Senior staff review every report | Quality depends on judgment instead of process | Build exception-based QA rules and junior-friendly checks |
| Clients ignore reports | Report answers internal questions, not executive decisions | Rebuild the report around decisions, risks, and next actions |
| Every client report is custom | No standard reporting architecture | Create modular templates with client-specific sections only where needed |
| Reporting takes over account management | Too many status explanations happen after delivery | Add narrative summaries, assumptions, and known gaps before sending |
This diagnostic step is unglamorous, but it prevents expensive false fixes. If campaign naming is broken, a new dashboard will still show messy data. If every client has a different definition of MQL, AI will summarize the wrong thing faster. If QA depends on a founder, hiring another junior marketer will not remove the constraint.
Step 1: Define the reporting promise
Before you redesign the workflow, define what your agency is promising through reporting.
A weak reporting promise sounds like this: “We send a monthly performance report.”
A stronger reporting promise sounds like this: “Every month, we show what changed, why it likely changed, what we recommend doing next, and what decisions require client input.”
That promise gives the process a clear endpoint. The goal is not a deck. The goal is a decision-ready client conversation.
This also helps you avoid overreporting. Many agencies include every metric because they fear leaving something out. The result is a report that looks thorough but fails to guide action. If a metric does not change a recommendation, explain a risk, or support a client decision, it may belong in an appendix, not the main narrative.
If your agency struggles with report content more than workflow speed, the guide on building B2B reporting clients actually read is a useful companion to this operational fix.
Step 2: Standardize metric definitions and naming conventions
Reporting bottlenecks often begin weeks before the report is built. They start when data enters the system inconsistently.
For example, if one campaign is named “Q3-LI-DemandGen-US” and another is named “linkedin demand gen usa q3,” your team will waste time cleaning, filtering, and debating what belongs where. The reporting delay appears at the end of the month, but the cause happened during campaign setup.
Create a simple metric dictionary that defines the core metrics used across accounts. It does not need to be complicated. It needs to be used.
Your metric dictionary should clarify:
- The exact metric name used in client reporting.
- The source of truth for that metric.
- The formula, if the metric is calculated.
- The owner responsible for resolving discrepancies.
- Any known caveats, such as attribution limitations or CRM sync delays.
Then pair that dictionary with naming conventions for campaigns, audiences, assets, landing pages, UTMs, and CRM fields. This reduces reporting friction because the team no longer has to reconstruct context later.
This is also where QA becomes easier. A junior team member can check whether a campaign follows the naming convention. They cannot reliably infer a messy campaign’s meaning at the last minute.
Step 3: Separate data assembly from analysis
One of the biggest reporting mistakes is asking the same person to collect data, clean it, analyze it, write the narrative, and prepare the client-facing version in one sitting.
That creates cognitive overload. It also makes delays harder to spot because everything is bundled into one vague task called “reporting.”
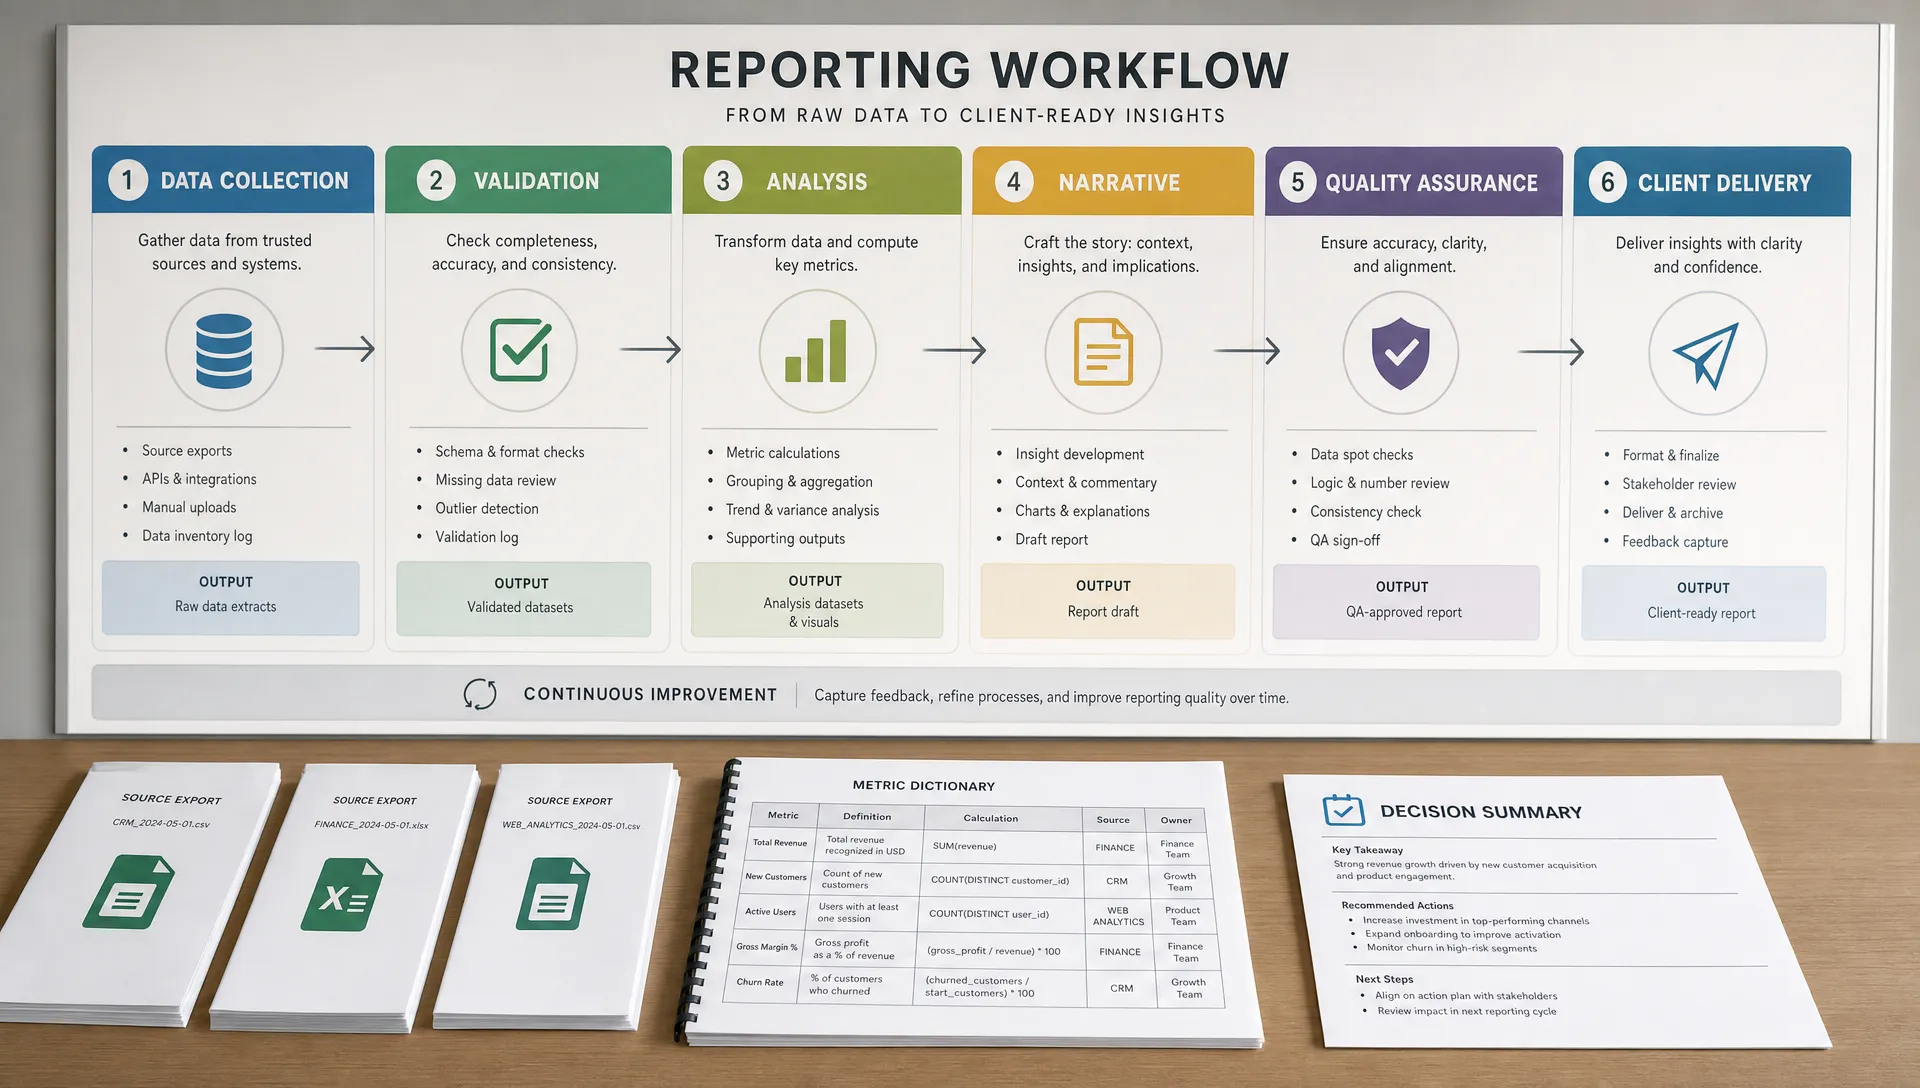
Separate the workflow into distinct stages:
| Stage | Output | Owner type |
|---|---|---|
| Data assembly | Current numbers pulled into the right template | Ops or delivery coordinator |
| Data validation | Errors, missing values, and anomalies flagged | QA owner or channel specialist |
| Analysis | Key changes, causes, risks, and opportunities identified | Strategist or senior specialist |
| Narrative | Client-ready explanation and recommendations drafted | Account lead or strategist |
| Final QA | Numbers, claims, links, and next steps checked | Reviewer not responsible for the draft |
| Client delivery | Report sent with decision points and meeting agenda | Account manager |
This separation makes bottlenecks visible. If data assembly takes two days, you know where to automate. If analysis waits on one specialist, you know where to create rules, thresholds, or delegation paths. If final QA creates the delay, you know the report is entering review too late or with too many preventable errors.
The principle is not unique to agencies. Premium service businesses, from event teams to executive mobility partners like Stuur Chauffeurs, protect client trust by coordinating logistics before the client feels the friction. Agency reporting should work the same way: the visible client experience depends on invisible operational reliability.
Step 4: Build a QA gate before you automate
Automation without QA is how agencies scale mistakes.
A good reporting QA process does not require senior leaders to inspect every number manually. It gives the team a clear way to detect common errors, escalate unusual findings, and confirm that the narrative matches the data.
Create a QA checklist that covers three categories: data integrity, interpretation, and client readiness.
For data integrity, check source freshness, date ranges, filters, currency, attribution windows, CRM sync status, and obvious outliers. For interpretation, check whether claims are supported by the data and whether recommendations match the client’s goals. For client readiness, check whether the report states what changed, why it matters, and what happens next.
The goal is not perfection. The goal is a consistent standard that prevents preventable mistakes from reaching the client.
If you want a deeper workflow for the QA side specifically, Archer’s article on speeding up reporting and QA for B2B ad agencies breaks down the foundations that should exist before advanced automation.

Step 5: Automate the repeatable parts, not the strategic judgment
Once the workflow is defined, automation becomes much safer and more useful.
The best early automation candidates are repetitive, rules-based, and easy to verify. In marketing agency reporting, that usually includes data pulls, template population, missing-field alerts, naming convention checks, recurring task creation, and draft summaries based on approved inputs.
Be careful with automating recommendations too early. Strategy is where context matters most. AI can help structure analysis, identify anomalies, and draft explanations, but it should not invent business context or replace the strategist’s judgment.
A practical automation sequence looks like this:
| Automation area | Why it helps | Risk level |
|---|---|---|
| Data collection | Reduces manual copying and late starts | Low if sources are stable |
| Template population | Speeds up recurring report production | Low to medium |
| QA alerts | Flags missing data, unusual swings, or naming issues | Low to medium |
| Narrative drafting | Gives account leads a structured first draft | Medium |
| Recommendation support | Helps compare options and summarize rationale | Medium to high |
This is where many agencies get the order wrong. They start with AI-generated commentary because it looks impressive. But if the underlying data is inconsistent, the commentary will be fragile.
Start by automating the operations layer. Then use AI to assist the human judgment layer.
Step 6: Move reporting work earlier in the month
Monthly reporting bottlenecks often happen because agencies wait until the reporting deadline to begin reporting work.
Instead, treat reporting as a continuous workflow. The final report should be the packaging of insights the team has already been collecting, not the first time anyone looks closely at performance.
A simple cadence can reduce the end-of-month scramble:
- Weekly: Check source data health, campaign naming, tracking issues, and major anomalies.
- Mid-month: Capture early insights, risks, and questions for the strategist.
- Five business days before delivery: Lock the reporting period, assemble data, and begin QA.
- Three business days before delivery: Draft the narrative and recommendations.
- One business day before delivery: Complete final QA and prepare client discussion points.
This cadence also improves client communication. If a campaign underperforms, the client should not learn about it for the first time in the monthly report. The report should confirm what happened, explain what was done, and clarify what decision is needed now.
Step 7: Use exception-based review
If every report requires the same level of senior review, your agency will eventually hit a ceiling.
Exception-based review means reports move through a standard process unless something triggers escalation. This protects quality without making senior people the bottleneck for every client.
Escalation triggers might include a major budget shift, unusual conversion drop, CRM data discrepancy, client-visible tracking issue, missed SLA, or recommendation that changes strategy. Everything else follows the normal QA path.
This approach has two benefits. First, it gives junior team members clearer authority. Second, it preserves senior attention for the reports that actually need it.
If your agency’s reporting bottleneck is part of a larger delivery problem, it may be worth reviewing the broader systems that protect margin across onboarding, research, creative, reporting, and follow-up. Archer’s guide to agency marketing systems that protect your margin covers that bigger operating model.
Step 8: Make the client handoff decision-focused
A clean internal workflow still fails if the client receives a confusing report.
Do not send a report with a generic message like “Attached is this month’s report.” That forces the client to interpret the work on their own, and it increases follow-up questions.
Instead, package the handoff around decisions. The message should summarize what changed, what you recommend, what you need from the client, and what will happen next.
A strong client handoff includes:
- The top three takeaways in plain English.
- The most important risk or uncertainty.
- The recommendation the agency is making.
- The decision or approval needed from the client.
- The agenda for the next call.
This reduces bottlenecks after delivery. Many reporting workflows technically finish when the report is sent, but operationally they continue through follow-up questions, clarification calls, Slack threads, and internal rework. A decision-focused handoff closes more of that loop upfront.
The 14-day reporting bottleneck fix
If your agency is overwhelmed, do not try to rebuild everything at once. Use a focused two-week sprint.
| Day range | Focus | Output |
|---|---|---|
| Days 1 to 2 | Map the current workflow | List of steps, owners, delays, and rework loops |
| Days 3 to 4 | Define report purpose and core metrics | Reporting promise and metric dictionary |
| Days 5 to 6 | Standardize inputs | Naming rules, source-of-truth decisions, and required fields |
| Days 7 to 8 | Create QA checklist | Data, interpretation, and client readiness checks |
| Days 9 to 10 | Redesign the reporting template | Modular structure focused on decisions |
| Days 11 to 12 | Add low-risk automation | Data pulls, task reminders, and missing-data alerts |
| Days 13 to 14 | Test on one client account | Bottleneck review and process adjustments |
The goal of this sprint is not to create the perfect reporting machine. The goal is to remove the largest constraint and create a repeatable model that can be improved.
Start with one representative client account. Choose an account with enough complexity to reveal real problems, but not the most chaotic account in the portfolio. Once the workflow works there, adapt it to other accounts.
How to know the bottleneck is actually fixed
A reporting bottleneck is fixed when speed improves without reducing quality or increasing hidden labor.
Track a few operational metrics for at least two reporting cycles:
| Metric | What it tells you |
|---|---|
| Time from period close to report delivery | Whether the overall process is faster |
| Number of QA issues found before client delivery | Whether internal quality control is catching problems |
| Number of client clarification questions | Whether the report is easier to understand |
| Senior review hours per report | Whether the process still depends on expensive talent |
| Rework hours after delivery | Whether the report is truly complete when sent |
Avoid celebrating speed alone. A report delivered two days faster but followed by three days of client confusion is not a win. The real target is faster reporting, cleaner QA, clearer decisions, and less senior dependency.
Frequently Asked Questions
What causes most marketing agency reporting bottlenecks? Most bottlenecks come from unclear ownership, inconsistent data inputs, weak metric definitions, manual data assembly, and last-minute QA. Tools can contribute, but workflow design is usually the deeper cause.
Should agencies automate client reporting? Yes, but only after standardizing the process. Automate repeatable tasks such as data pulls, template population, QA alerts, and recurring handoffs first. Keep strategic interpretation and client recommendations human-led until the inputs are reliable.
How often should agency reports be reviewed for QA? Every report should go through a basic QA checklist before delivery. Senior review should be reserved for exceptions, such as unusual performance swings, tracking issues, major budget changes, or strategic recommendations.
What is the fastest way to improve agency reporting? The fastest improvement is usually separating data assembly, QA, analysis, narrative, and client delivery into distinct stages with clear owners. This makes delays visible and allows automation to target the right work.
Do reporting bottlenecks mean an agency needs to hire? Not always. If the process is undocumented, inconsistent, or dependent on senior staff for routine checks, hiring may only add more coordination overhead. Fix the operating system first, then decide whether more capacity is truly needed.
Turn reporting from a margin leak into an agency system
Marketing agency reporting should not require a monthly rescue mission. When the workflow is standardized, QA is built in, and automation supports the right steps, reporting becomes faster, calmer, and more valuable to clients.
That is the kind of operational leverage Archer Scaling AI is built to install. The work starts with a paid Margin Teardown that identifies where delivery margin is leaking and outlines practical automation moves your agency can use. From there, Archer can build and run the AI ops layer across workflows like reporting, onboarding, research, CRM, and content operations.
If reporting is slowing your team down, the next step is not another dashboard. It is finding the constraint and removing it. Visit Archer Scaling AI to see how the system works before you commit.